Earlier this year, crude oil bounced off its multi-year low, and many market participants are now trying to determine where crude will head in the near future. Thus, it seemed timely to examine the seasonality of the front month of WTI Crude Oil futures to offer possible paths it may take.
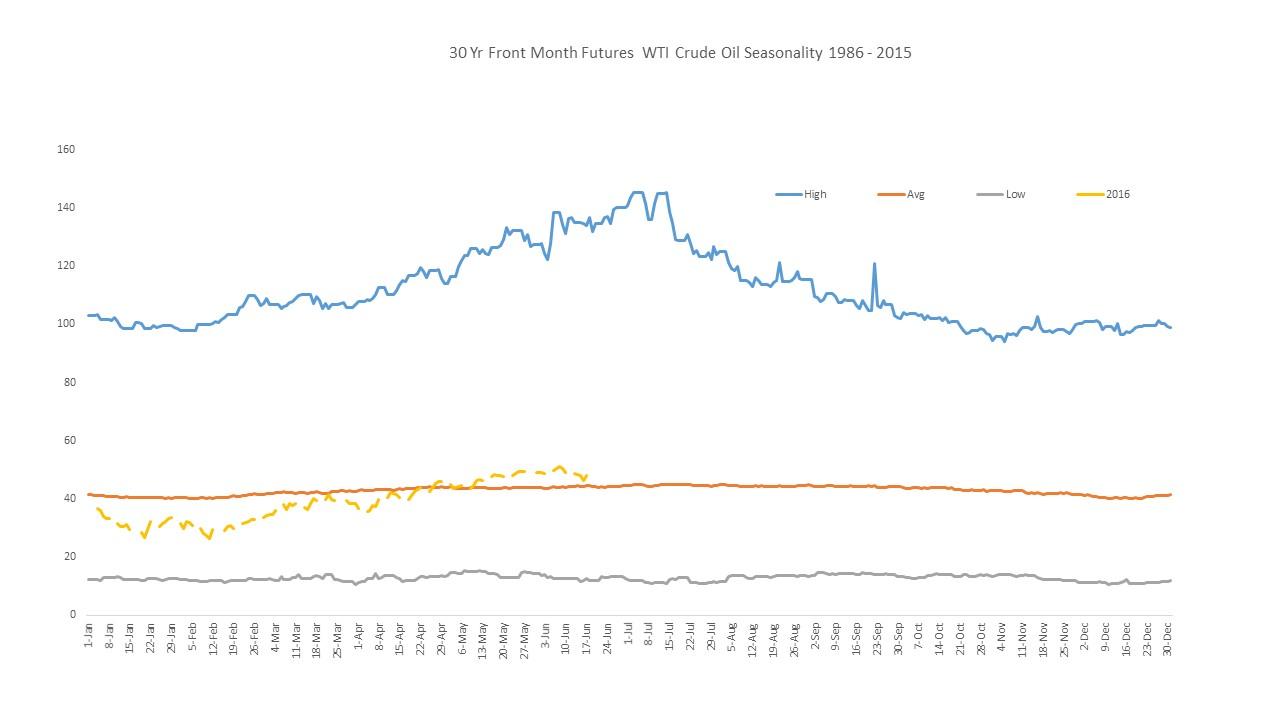
Chart 1 finds three important points of discussion regarding crude oil's historical seasonality:
- The 30-year average front-month futures contract has hovered between $40 and $45.
- The current price as of June 20, 2016, is around the 30-year average price $CL_F front month. So it is right on par with the 30-year average performance.
- The 30-year seasonality shows a tendency for the market to decline in the second half of the year. This doesn't mean the second half of the year will see a decline, but only a tendency for it to occur.
Chart 1: 30-Year Seasonality of WTI Crude Oil Front-Month Futures Contract
 Source: Bloomberg data
Examining the 10-year $CL_F front-month contract seasonality chart, the data has increased weighting towards the 2008 rally. This causes a higher average range of about $71 to $88 versus the 30-year data. The range of the low prices is also noticeably higher ranging from $61 to $33. This puts the current pricing below the 10-year seasonal low. Once again, the chart notes the seasonal drift lower in the second half of the year. If crude remains in a trading range later this year, it could become similar to the 10-year seasonal low.
By Mark Shore, Founder www.shorecapmgmt.com